


The cryptocurrency market is infamous for its volatility and its sheer unpredictability. A token that is high right now need not be high in the next hour and vice versa. The instability of the market is something that all traders and market participants have to keep in mind and eventually figure out ways to deal with it and work around it to safeguard their digital assets.
To this effect, many traders and market participants take up technical analysis of digital assets, tokens and coins. The technical analysis of assets helps bring down the instability and uncertainty by predicting a trend that the asset could take. Technical analysis essentially takes historical data, current data, market state and community response into account and then forecasts a trend that the coin or asset could possibly take.
At the core of technical analysis, is mathematics. Using real time data like revenue, profit and turnover, the analyst figures out a mathematical model that predicts all the possible trends that the asset could take. And based on external factors like community support and market stabilisation, reveals which scenario is most likely to occur.
Technical analysts in the past have said that they rely heavily on technical indicators. Technical indicators essentially help technical analysts figure out the longterm direction of the asset. There are six technical indicators that are commonly used by analysts to determine the trend that the asset is most likely to take.
Best Indicators for Cryptocurrency
-
Relative Strength Index
The relative strength index is a commonly used technical indicator. It originates from the stock market and is heavily used. The technical indicator essentially is used to determine and quantify losses and gains over a fixed period of time.
This particular technical indicator is also used to determine whether a particular asset, with respect to the cryptocurrency market, is oversold or overbought and whether the market is bearish or bullish. The index is measured between 0 to 100. And in the cryptocurrency market if the index is below 50 it is bearish and above is bullish.
The only disadvantage of this method of predicting the trend of an asset is that it is very susceptible to sudden spikes and drops in the market and hence is very prone to giving out false results. -
Moving Average Convergence Divergence
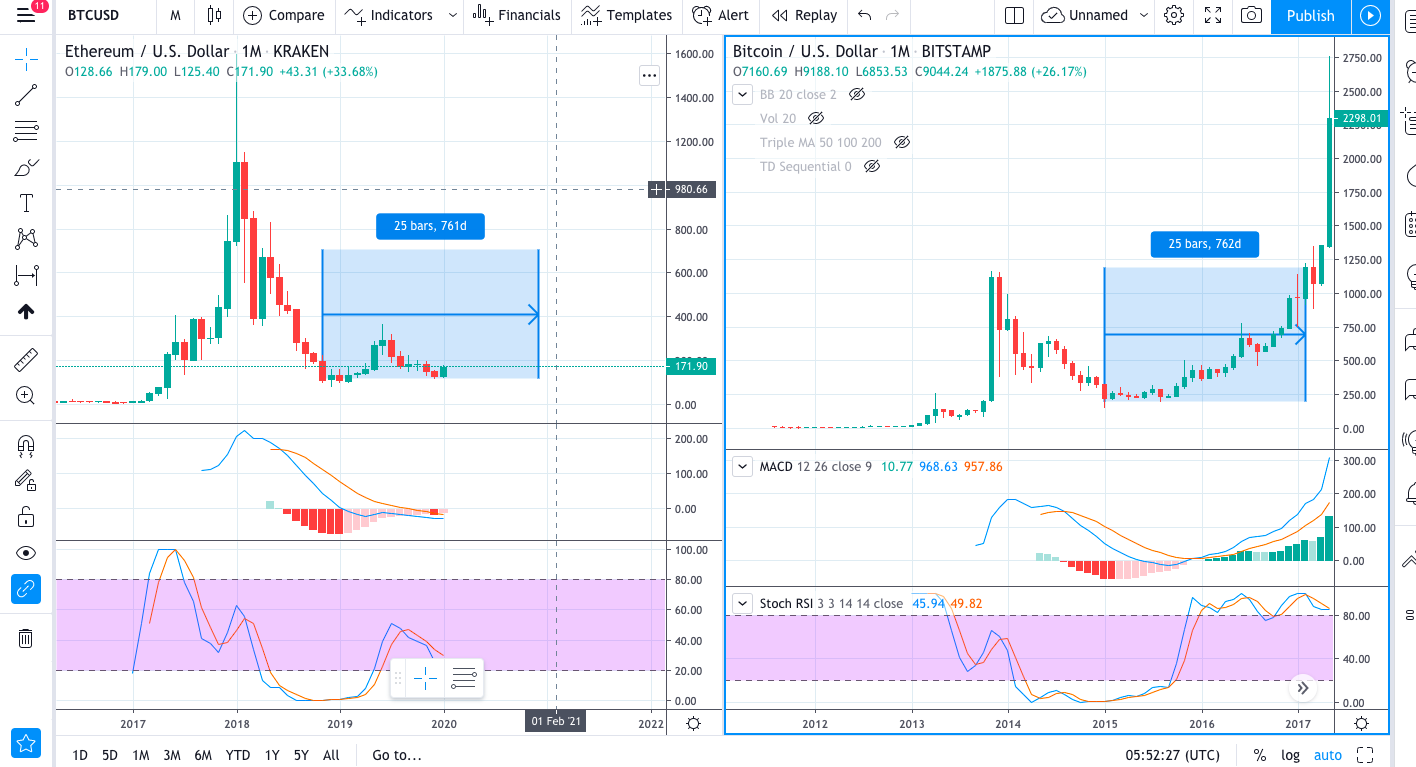
The Moving Average Convergence Divergence (MACD) is an age-old technical indicator that has been used in all markets so far. It is essentially a number that is calculated and the result of which determines whether the asset is moving upwards or downwards and based on that it is decided whether to buy or sell.
The Moving Average Convergence Divergence is calculated by subtracting the 26-day exponential moving average (EMA) from the 12-day exponential moving average. The result is said to be positive and is time to buy the asset if the 12-day EMA is higher than the 26-day EMA. And the result is said to be negative and in a downward direction if the 12-day EMA is lower than the 26-day EMA. -
Average Directional Index
The Average Directional Index is a technical indicator that determines the strength of a trend. It essentially determines whether the upward or downward trend of an asset or coin is sustainable, strong and thus trustable. The Average Directional Index is basically a quality check on the trend.
The index is also measured from 0-100. Depending on where the number stands, the strength of the trend is determined. Average Directional Index score below 50 is considered a weak trend and above 50 a strong one. A number below 25 is not considered as a trend at all. -
On Balance Volume
The On Balance Volume momentum identification method that on the basis of the volume of the trend determines the price of the asset in the near future. The On Balance Volume of a trend is calculated as a running total of positive and negative trading volumes on the asset.
Depending on the volume, if it is decreasing the On Balance Volume will predict to what price the asset will fall and if it is increasing the OBV will predict to what price it will rise in the near future.
This method can only be used granted that there is a huge difference or shift in the volume of the asset. -
Stochastic Oscillator
The Stochastic Oscillator is a technical indicator that indicates and then intimates the momentum of the trend. The technical indicator is a momentum indicator that shows the user which way the trend is headed. The Stochastic Oscillator takes an average of 14 days before predicting which way the token goes.
The result of the Stochastic Oscillator is generated by calculating the difference between the closing price of the asset and the range of prices over a particular time period. The result will usually lie between 0-100 and above 80 is an overbought asset and below 20 is an oversold asset.Must Read Does Technical Analysis Actually Work?
Do check out Video tutorial to learn technical analysis
Subscribe to biggest crypto news aggregator so you don’t miss any news on Telegram
Subscribe to get notified on latest posts.


