


In the last one week, Bitcoin [BTC] price has stayed in a $250 range with no signs of a bullish or bearish confirmation. Even the hysteria brought on by the Twitter hack was unable to cause a flash crash below $9150.
The lows and high for a definitive swing trade is at $8,500 and 10,320. On shorter time frames, the trend has been bearish from a while as the price has failed to make a higher high above $9,500. The sell-off, however, has been limited above $9150.

The volatility in Bitcoin price right now has not dropped so low in the past 1.5 years. In BTC price history, such low levels of volatility were witnessed during 2019 reversal to bull markets and in 2016 before and after halving in July. The fractals from around the 2016 price action are particularly interesting.
The Price Action (PA) witnessed a similar hysteria and sell-off as it did in 2016. However, this time in 2020 it was accompanied by a ‘black swan’ event due to COVID-19 lockdown. The sentimental uncertainty now prevails due to the risk in its price and the future prospects of usability to gain financial freedom from the inflated FIAT currencies.

The Bollinger Bands have squeezed tightly and is awaiting a huge break-out. The last time the bands were squeezed in so tightly was before the 2018 drop from $6,400-$3,200 and before the bull run from $4,200 to $14,000 is 2019.

We can witness huge moves in Bitcoin price over $1000, which is important because it is likely to continue in that direction in the following weeks.
Bitcoin Hash Ribbons
On the supply side, the momentum has returned towards the buyers according to hash/difficulty ribbons. Post halving in the second week of May, the hashrate dropped creating doubts of capitulations. Nevertheless, we are witnessing a recovery in the hash rate and difficulty since mid-June.

In the past, this has acted as a potent signal because of the dominance of the miners on the price. The miners have to sell a portion of the Bitcoins to meet the cost of electricity and maintenance.
Furthermore, with the launch of new efficient miners, the selling pressure on the miners have reduced considerably. The development of sophisticated derivatives market in options and futures is providing a cushion to the miners to hedge their production. This is allowing the miners to generate stable returns without actually causing a massive change in price.
As the network continues to grow, this can still be viewed by spikes on miner outflows to crypto exchanges which usually represent sell orders.

The spikes in the miner outflows are usually indicative of a huge sell-off in the market. Notice the recent spike to 7.5k in above the July market. This occurred on 23rd June 2020, following which the price dropped to lows around $9000. Nevertheless, the sell-off was limited to a small price range which represents the strength of the bulls. However, looking back to October 2019, the apprehension of around a bearish correction is intact.
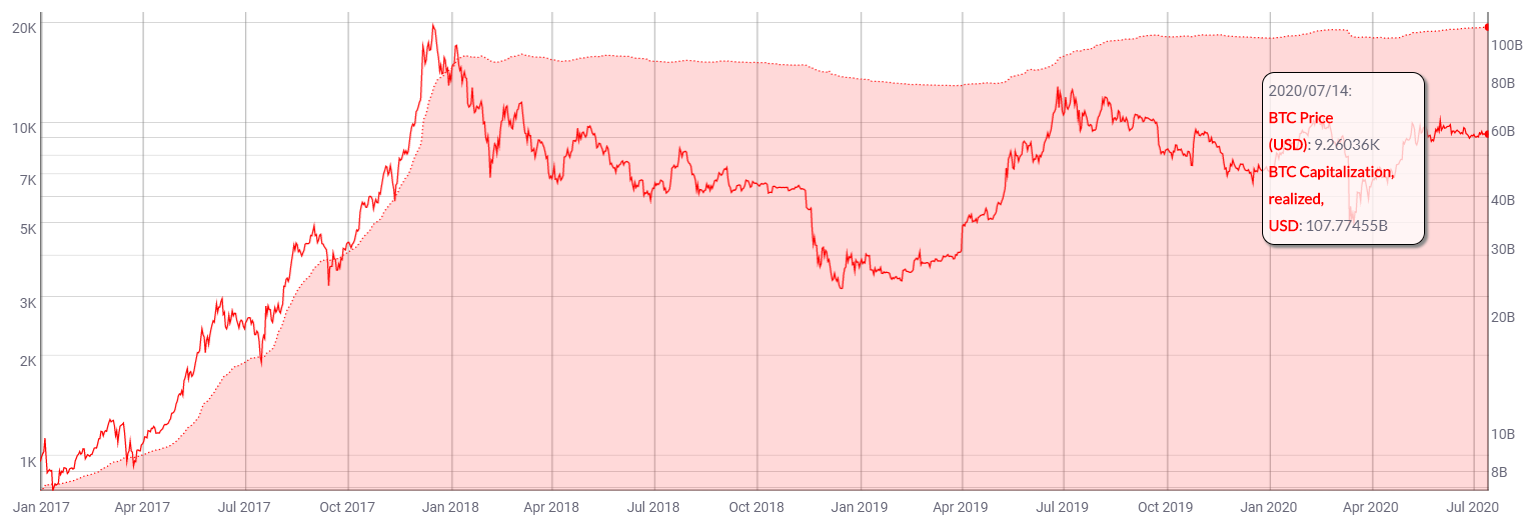
Realized Value
The realized value of Bitcoin is above $107 billion, at par with the ATH levels in Bitcoin. Moreover, during the previous times, such high levels of realized market capitalization were brought on by the bull runs.
As the realized market capitalization calculates the on-chain value moved in Bitcoin, the consistency reflects considerable growth.
However, the crypto market is witnessing a shift towards stablecoins, and with the introduction of CBDC, it might act as a threat to Bitcoin. The comparative growth in the market capitalization of Stablecoins has been massive. Moreover, the velocity of the transactions on stablecoins has surpassed Bitcoin and Ethereum. This is primarily due to two reasons,
- Volatility in the price of Bitcoin
- The high transaction fees compared to Ethereum and Stablecoins.
Nevertheless, Bitcoin adds higher intrinsic value via its’ Store of Value (SoV) characteristics. The ‘hodlers’ from the past 3-5 years are still unshaken by the move.

In fact, the number of active Bitcoin addresses is on par with the 3 years high. There are over 900,000 Bitcoin addresses and the increasing trend has been observed across all classes of Bitcoin addresses including whales (BTC balance > 1000) and retail buyers (BTC balance between 0.1-100).
Moving Averages
The price is trading above the 50 and 200-period moving average (Simple and Exponential) on a weekly scale. The 50-period EMA (Exponential Moving Average) on the weekly is presently at $8360.
On the daily scale, it sketched the golden cross of the 50 and 200-period Exponential Moving Average (EMA) and the price continues to protect the 50-Day EMA as support. This is positive signals for the bulls as well.
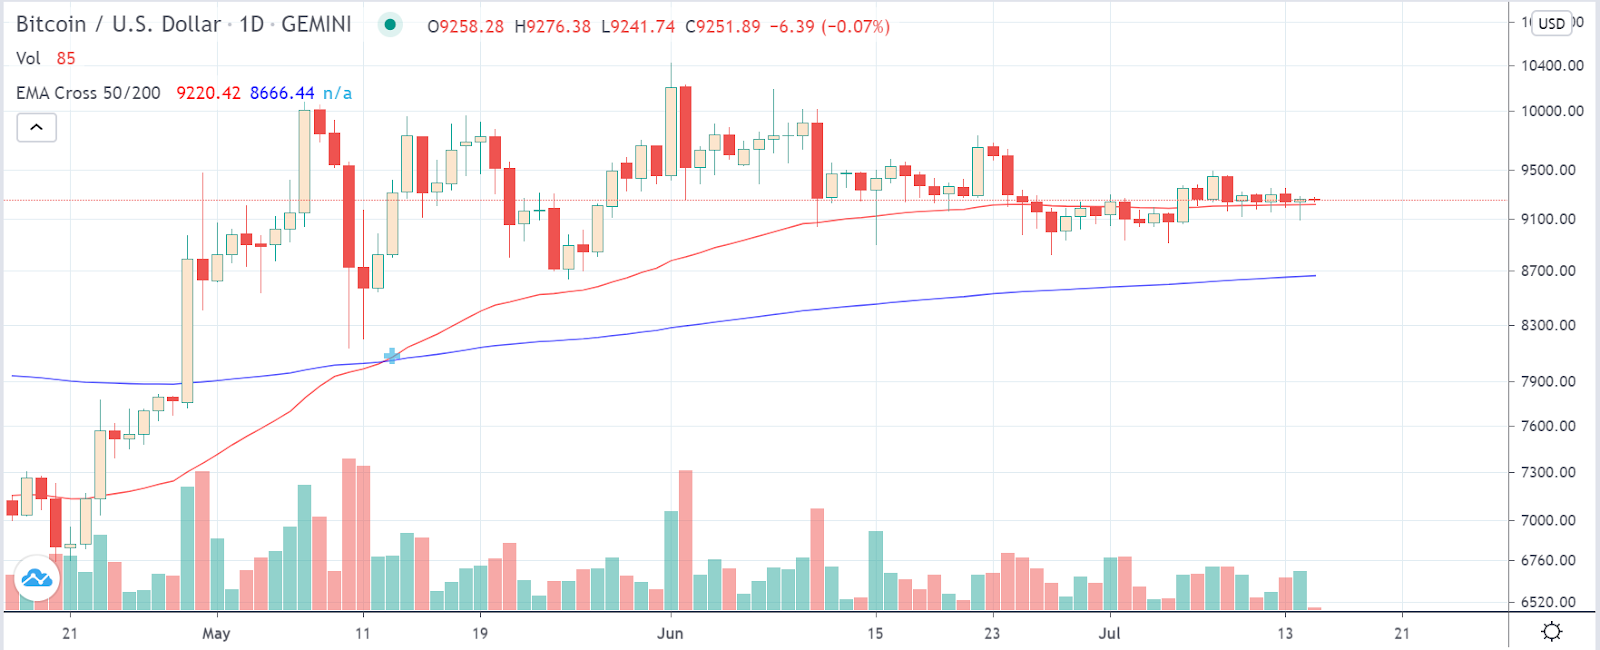
The 200-Day Simple Moving Average is at $8510; as long as price stays above it, the bullish argument is intact. Moreover, due to the lack of volatility, the PA still hasn’t recorded a lower low for confirmation of the bearish reversal. The range of values for a confirmed bearish signal is below $8,700-$8,300. In case of a drop, we are likely to see another parallel range around $8500 due to the confluence of the moving averages around the region.
Volume Indicators
The volume indicators suggest that buyers are stepped heavily after the 2019 crash and it might be preparing for another bull-run to test 2019 highs. However, after halving there was a strong sell-off in the market which has created uncertainty around the continuance of the bullish move for the past 2 months.
The CMF ratio signalled a buy in the aftermath of the COVID-19 crash around March 12-13, 2020. The buying volume continues to be strong despite halving and apprehensions of a crash.
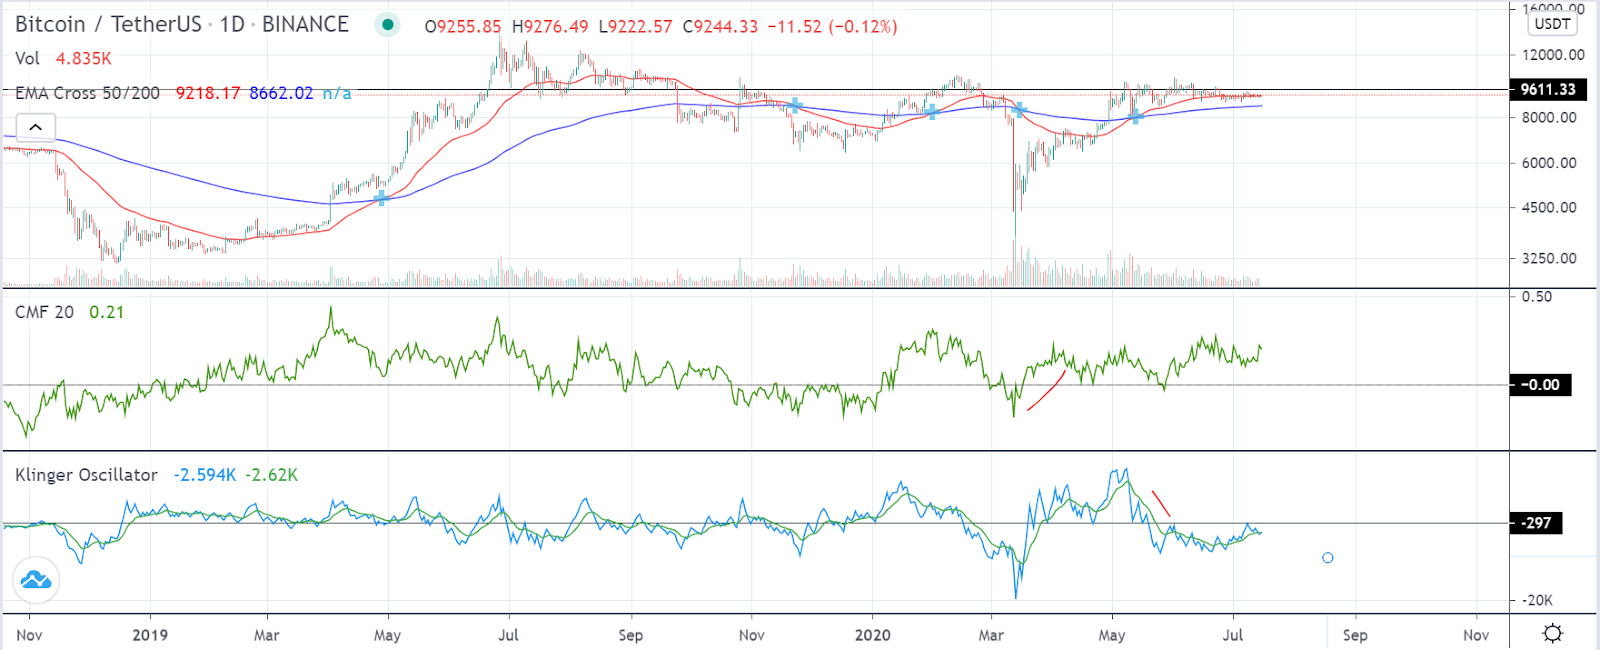
Nevertheless, the Klinger Oscillator suggests heavy selling post halving and continues to signal a pullback. A deeper look into the two indicators suggests that due to lack of volatility in the price, the price closing in higher on the daily range. Nevertheless, it can witness a quick reversal if the price begins to fall. This will be a strong sell-indicator of bearish reversal.
Long-Term Trend
Another potent bearish signal is the resistance from the downtrend since 2017 top. On a logarithmic scale, it is something that cannot be missed. The support from this triangle is at $6,000-$6,500. around the 200-Day EMA (currently at $6280.)
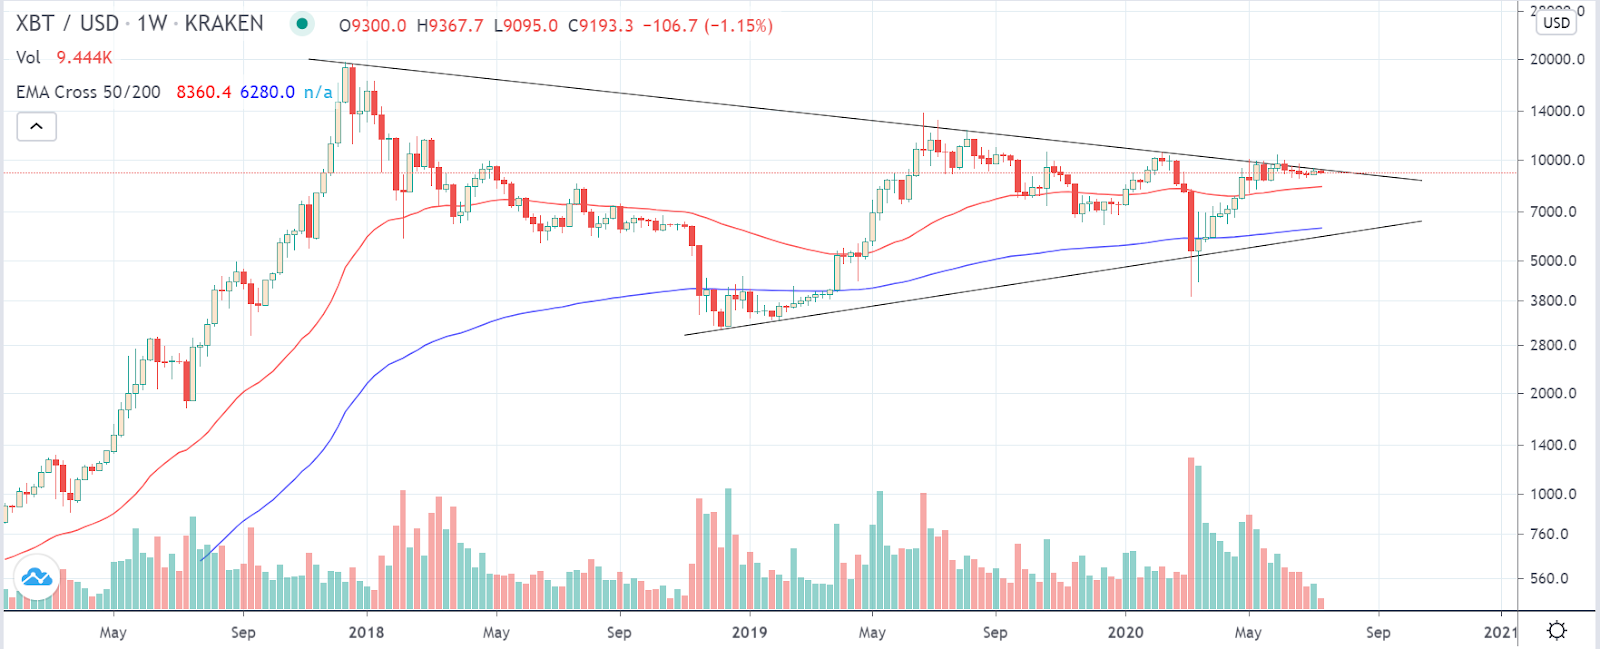
The monthly open for July is at $913x, this will be a significant level for the traders. A break below this level will motivate the sellers further.
The altcoin markets have been performing extremely well due to the DeFi push and the exorbitant rise in Chainlink [LINK], Cardano [ADA], and Tezos [XTZ]. DeFi is looking to expand the decentralized market (primarily lending and borrowing) into the mainstream with backing from Financial Services firms. Crypto traders usually engage in altcoin trading to increase the proportion of their Bitcoin holdings. A bullish altcoin market is likely to cause a liquidity flow in Bitcoin.
Last but not least, due to the negative sentiments brought about by the spread of COVID-19, a considerable number of traders are looking forward to another deep correction in asset prices. It includes Bitcoin; while its’ investors associate it closely with gold, the Price Action has had a stronger penchant with the stock markets. This is due to the apparent risk component in the Bitcoin, which is higher compared to gold.
However, with positive news around coronavirus vaccine along with the resistance to bears in these trying times could be indicative of new highs in stock market indices. This could likely cause an uptrend in Bitcoin as well.
Subscribe to get notified on latest posts.


