


The price of Ethereum shot up by more than 7% today, and at the time of writing this article, it sits at $3750, showing no signs of slowing down. We see extreme bullish behavior from all types of investors. Strong hands or whales are aggressively accumulating, adding to their long positions, and retail entities are still showing insane amounts of growth within the network.
After taking a good hard look at the on-chain metrics, we have observed quite a few exciting things that could have caused this massive uptick in price for the last one or two weeks. This article will break down primary on-chain metrics that you should pay attention to, as the next few weeks could be historic for Ethereum.
Correlation to BTC
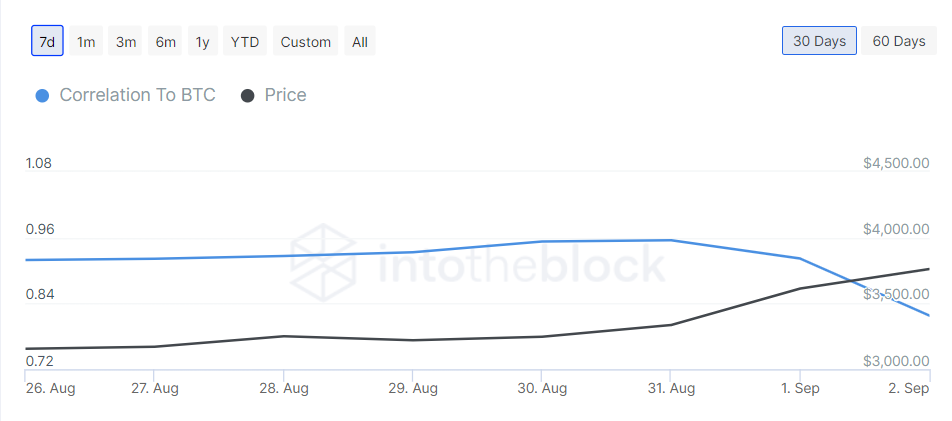
One of the most important metrics to monitor is the correlation to BTC. We need to see how Ethereum performs when Bitcoin is moving sideways. Even though we could see extreme greed being built up after crossing the $50k, it is still better to track ETH’s price performance in relation to that of BTC. In the 7-day time frame, we watched the correlation go down to 0.82, which is a 30-day low.
Average Transaction Fee
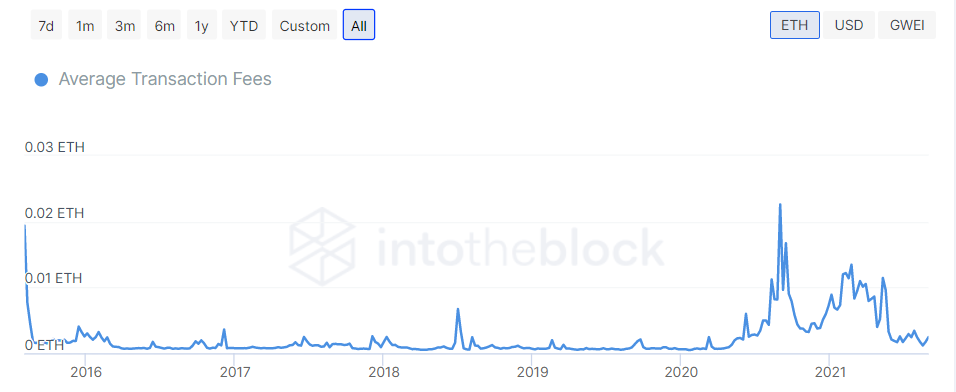
In terms of understanding price movement, it is not necessary to track transaction fees. Still, it is essential to notice differences in the market when a major update like London hard fork is released. We are four weeks into the upgrade to understand how the market is reacting to the base fee structure. As we can see from the stats, the average fees dropped significantly over the last couple of months. We need not overlook this metric, as it tells us how the fee changes with the price going up.
Break Even Price
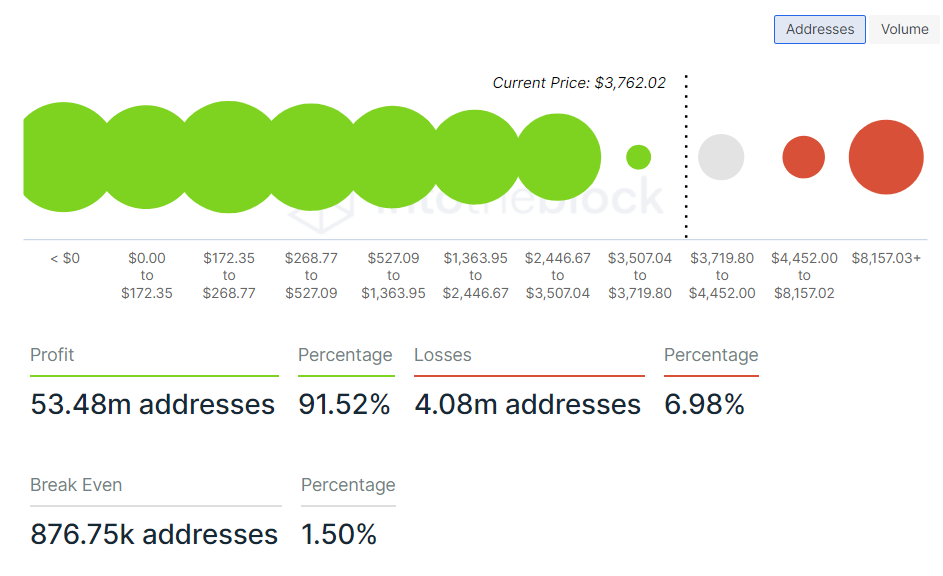
With Ethereum smashing its way to $3.5k, more than 90% of the addresses are in profits. The only ones in loss are people who bought at an all-time high. The remaining addresses are currently sitting with zero losses and profits. This is a notable on-chain metric for us to comprehend how much of the market is able to book profits and how much of it succumbed to selling pressure.
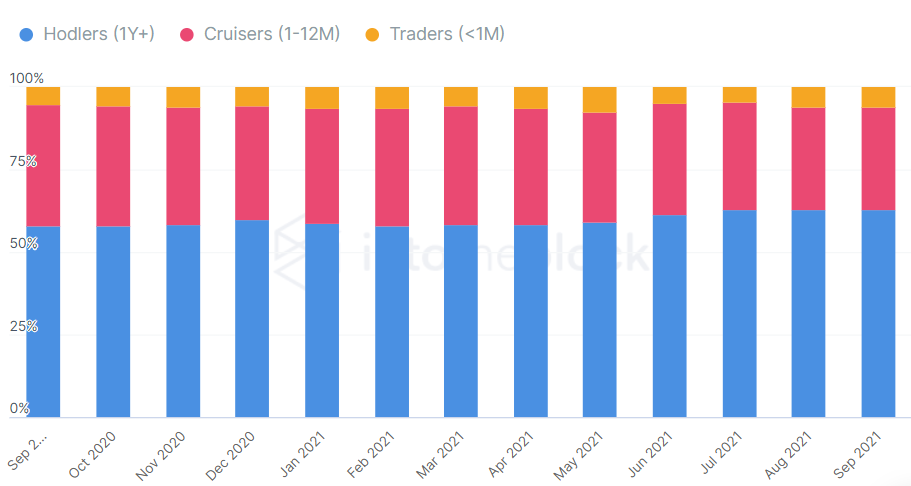
Ownership by Time held & Concentration
Equal wider distribution and less whale concentration is a good sign for any crypto in the long term. Along with decentralized nature, we get to see more participants from retail and medium investors. In the present market conditions, 58% of network participants are retail holders, and 18% are whales. If we look at the ownership by time held, we can see that long-term holders are dominating the market by adding more and more ETH to their positions. Soon, the cruisers will join long-term holders, making them less susceptible to high volatility.
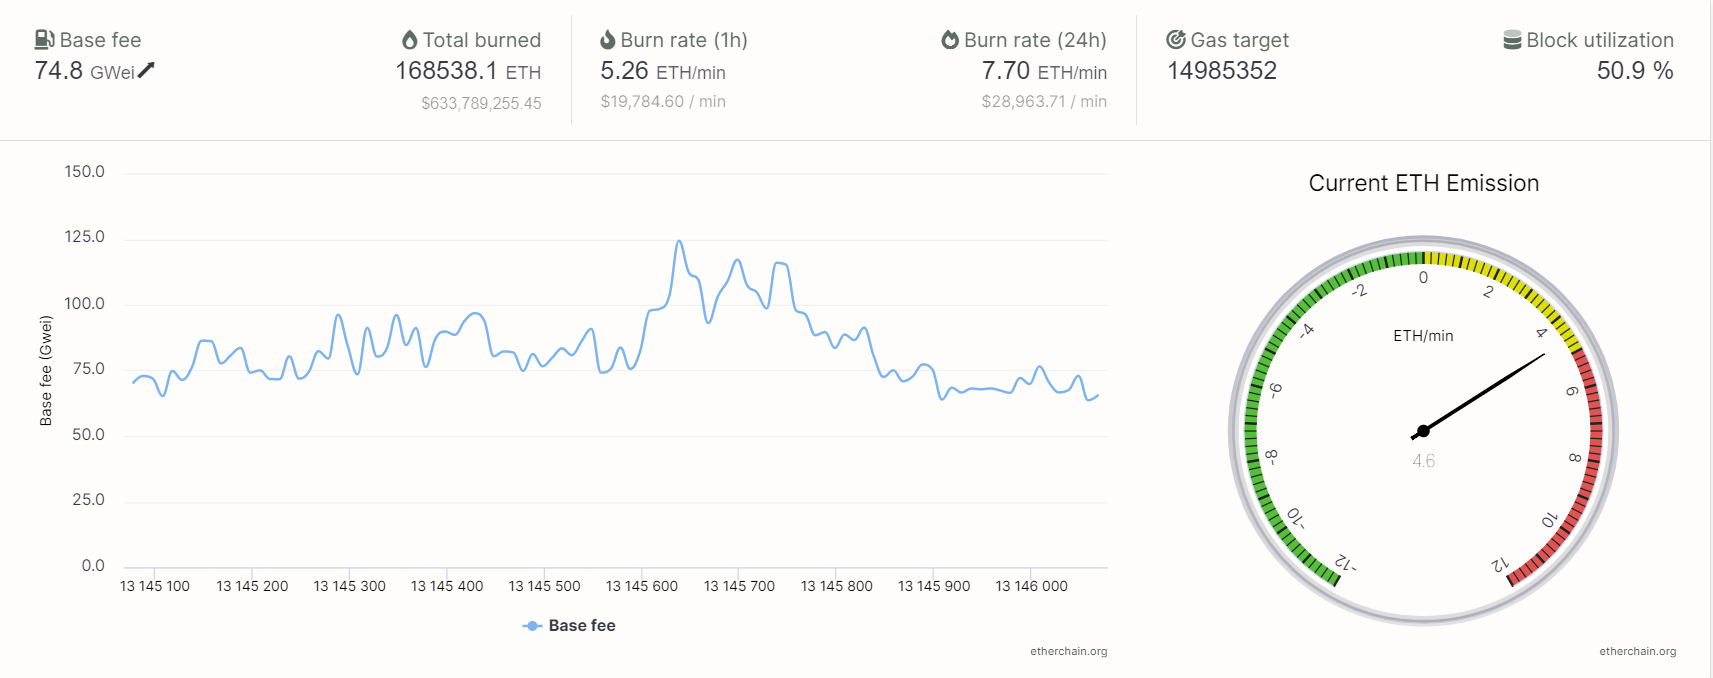
ETH Burn Rate
After the release of the most hyped update of the Ethereum network, the price of ETH went from $2400 to $3400 in a short period. We said earlier that this upgrade will not make the token a deflationary asset but will drive up the price significantly, depending on the burn rate. Currently, the burn rate is at 7.7 ETH/min. That is nearly $29,000 burned in 60 seconds. In total, the network burned 168530 ETH, which is worth almost $633 million. If we continue to see this rise in burn rate, we will see millions of ETH being burned by the end of the year. As a result, the price will go higher and higher, given more support comes from retail.

Born and brought up in India, Karthikeya Gutta is a crypto journalist and freelance contributor for ItsBlockchain. He covers various aspects of the industry with in-depth analysis and research. His passion towards blockchain and crypto ecosystem is mainly because he believes it can really change the world and help millions of people.
Subscribe to get notified on latest posts.


